Predicting S&P 500 Stock Prices based on Last Closing Price
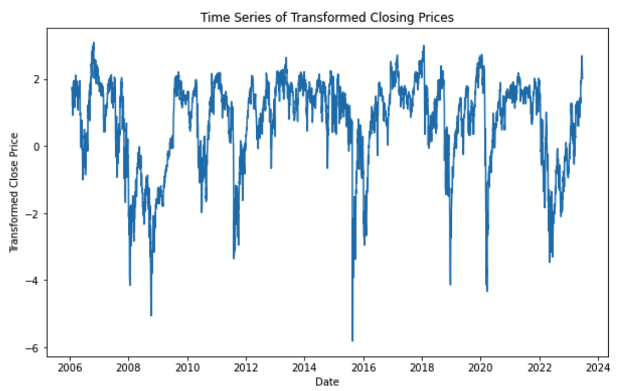
The stock market is dynamic, prompting experts worldwide to seek patterns within price movements and indexes diligently. I try to explore and focus on predicting the stock market by examining the S&P 500 prices and analyzing the closing prices from the preceding five days. To achieve this, I trained six models and studied the prices of 4379 days. I gathered stock prices using API through Yahoo Finance. I manually added the binary result column to the dataset, showing an increase and decrease in price. The dimensions of the dataset are 4380 by 7. For a numerical summary of the dataset, I graphed the mean and std of the important variables, showing descriptive statistics.


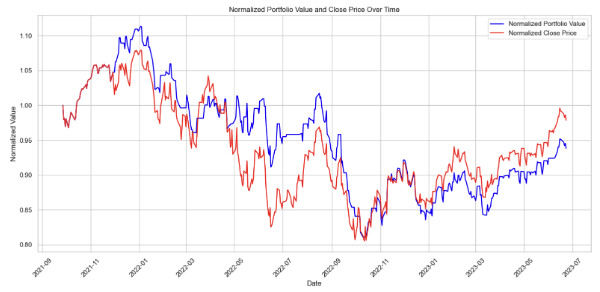
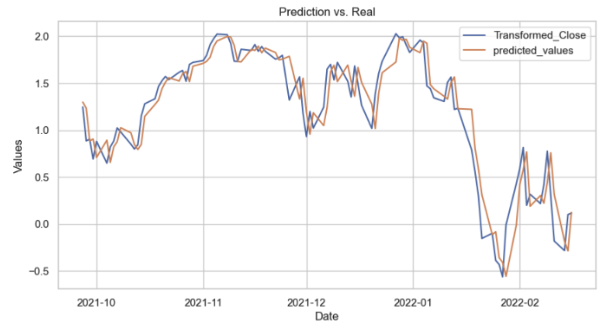
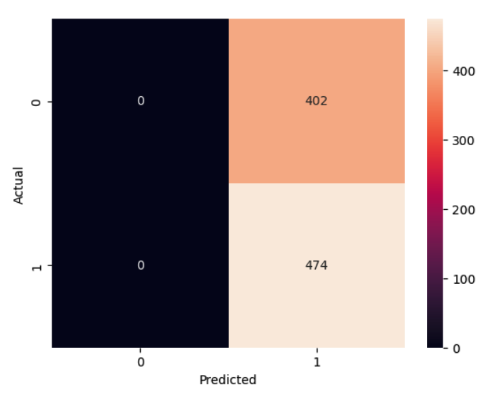
The logistic regression model may have a bias towards predicting one class more frequently, which can be due to the model's inherent biases, the way it's been trained, or the features it's using. I used SVC and Logistic Regression to determine how the closing price changed. The SVC parameters include a linear kernel and C value of 10, and Logistic Regression parameters include the default max iteration and C value of 100. Although both these models had accuracy scores around 54%, the model had many false positive predictions, as seen in the confusion matrix below. Aside from SVR and linear regression, I used other regression like kNN, Decision Tree, and Random Forest. After conducting a hyperparameter tuning, I concluded that our best model is linear regression with an R-squared of 96.39% on test data. This indicates that the strategy outperformed the S&P 500 index within the specified period, showcasing the efficacy of the predictive model.